Solar Projects Bankable
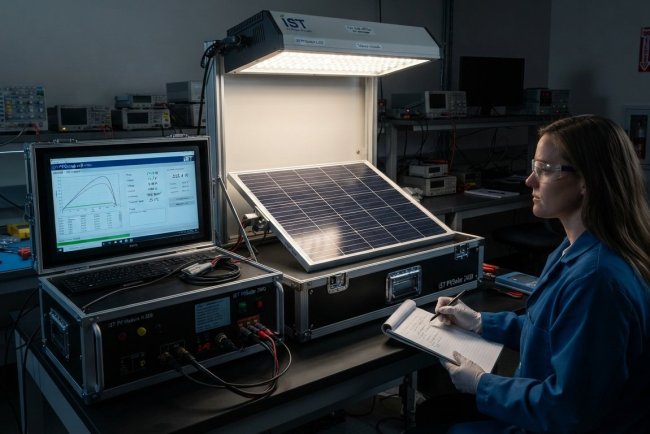
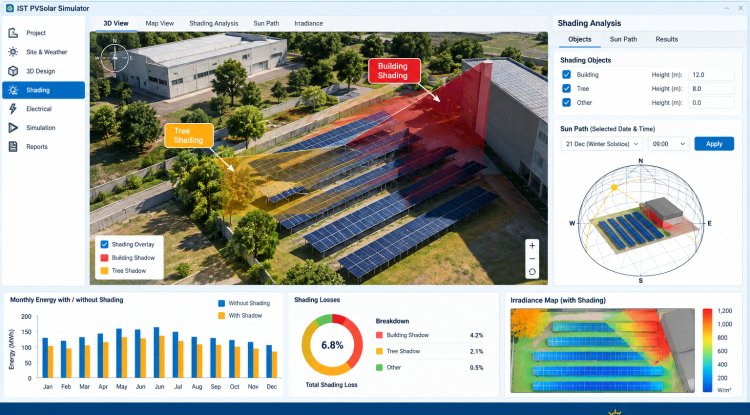
PR Newswire: I explored the tool at infinity.srtechno.in (IST PVSolar Simulator) to ground the post in what those two sections actually do, then wrote a blog article covering: Why project-level and equity-level models are kept separate (unlevered vs. levered returns), the P90-based LCOE/NPV/IRR/payback/ROI metrics, covenant colour-coding, and year-by-year projection, Equity IRR, DSCR, CAPEX/Wp benchmarking, and the investment decision framing for lender due diligence.
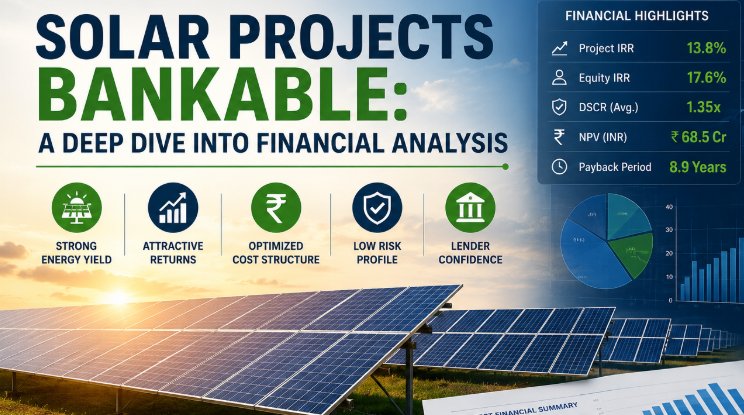
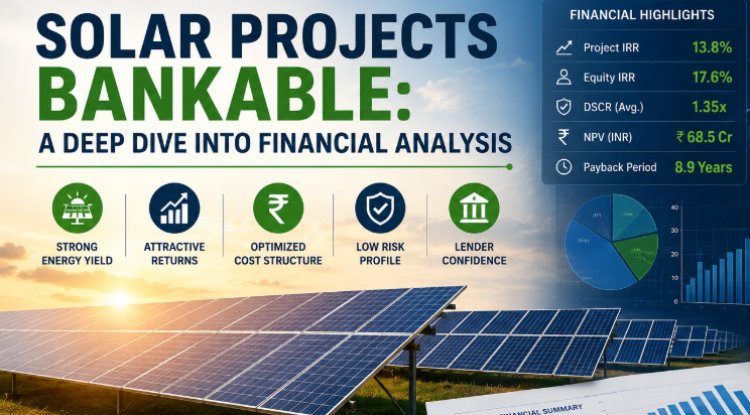
Making Solar Projects Bankable: A Deep Dive into Financial Analysis Results in the IST PVSolar Simulator
A solar plant can be engineered perfectly — the right modules, the right tilt, the right inverter loading ratio — and still fail to reach financial close. Lenders and investors don't fund kilowatt-hours; they fund cash flows. That's why the Financial Analysis Results module inside the IST PVSolar Simulator exists as a dedicated bridge between the engineering model and the boardroom — translating simulated energy yield into the numbers a bank, a fund, or an independent engineer actually needs to sign off on.
This module sits inside the simulator's Economic Evaluation and is split into two distinct, purpose-built views:
- A. Project-Level Financial Model — the "does this project make sense on its own merits" view
- B. Equity-Level Financial Model (Bankability Perspective) — the "will a lender and an equity investor actually put money into it" view
Together, they turn a technical yield simulation into a due-diligence-ready financial package.
Why Two Financial Models Instead of One?
A common mistake in early-stage solar financial modelling is treating "project returns" and "investor returns" as the same thing. They aren't.
- The project is financed by a mix of debt and equity, and its returns are judged independent of how it's financed — this is the Project IRR.
- The equity investor only receives what's left after debt service, so their return — the Equity IRR — can be significantly higher (or lower) than the project's own return, depending on leverage, interest rate, and repayment structure.
Lenders care about the project's ability to service debt (DSCR). Equity investors care about what's left over after that debt is serviced. A single blended IRR number hides both of these realities. That's why the simulator separates the two.
A. Project-Level Financial Model — Built on P90, Not P50
The headline number most people quote when discussing a solar project is P50 annual energy — the median-case yield estimate. It's a great number for a sales conversation. It is not the number a bank underwrites to.
The Project-Level Financial Model deliberately computes every metric using P90 energy — the exceedance level at which there's a 90% probability that actual generation will meet or beat the estimate. This is the conservative, lender-grade basis that reflects real-world resource uncertainty rather than a best-case average.
On this P90 basis, the model calculates:
- LCOE (₹/kWh) — the levelised cost of electricity, blending CAPEX and discounted OPEX against discounted lifetime energy
- NPV (₹L) — net present value of the project's future cash flows
- IRR (%) — the discount rate at which NPV equals zero
- Simple Payback (Years) — how quickly the initial investment is recovered, undiscounted
- ROI (%) — overall return on investment
- 25-Year Revenue (₹L) — cumulative lifetime revenue
- Discounted Payback (Years) — payback adjusted for the time value of money
- Profitability Index (PI) — value created per rupee invested
- Break-Even Tariff — the minimum tariff at which the project remains viable
Feeding this analysis is a full Year-by-Year Projection, run on the P90 energy basis, that walks through energy output, degradation, tariff escalation, revenue, OPEX, depreciation, tax, net saving, and both cumulative and discounted cumulative cash flow — year by year, for the entire project life. This is exactly the kind of granular table an independent engineer or lender's technical advisor will want to cross-check line by line.
B. Equity-Level Financial Model — The Bankability Perspective
If the Project-Level Model answers "is this a good project," the Bankability Perspective answers "is this a financeable project" — and those are genuinely different questions once debt enters the picture.
This section evaluates the deal the way a lender's credit committee would:
- Project IRR — unlevered return, ignoring financing structure
- Equity IRR — the actual return to the equity holder after debt service, the number sponsors care about most
- DSCR (Debt Service Coverage Ratio) — the ratio of cash available for debt service to the actual debt obligation in a given year; this is the single most-watched metric in project finance, tested against both a minimum covenant and a target average
- Payback — from the equity investor's specific vantage point
- CAPEX/Wp Benchmark — how the project's installed cost per watt compares against country- and segment-specific bankability bands (utility-scale ground-mount vs. rooftop/C&I are benchmarked separately, since their cost structures are structurally different)
- Investment Decision — a synthesised verdict drawing on all of the above
This is explicitly framed in the tool as being "suitable for a bankable MW-scale solar project due diligence report" — language that signals its intended audience: lenders, independent engineers, and equity investors conducting formal due diligence, not just a back-of-envelope feasibility check.
Beyond the Base Case: Where Uncertainty Gets Quantified
A bankable financial model can't just show a single-scenario answer — it has to show how that answer moves under stress. The simulator layers three further tools on top of the core financial results:
Monte Carlo Financial Risk Analysis runs the full 8,760-hour Perez irradiance engine through thousands of trials, producing P10–P95 exceedance bands for Year-1 energy, Project NPV, Equity IRR, and DSCR-by-year — turning a single-point estimate into a genuine probability distribution, the same kind of output lenders use to size debt against a P90 DSCR.
Financial Due Diligence extends the picture well past the numbers themselves — offtaker credit risk, permitting and grid-connection status, EPC and O&M contractor bankability, insurance program, country/currency risk, and IFC Performance Standards compliance (PS1–PS8) — the qualitative checklist that sits alongside every quantitative model in a real lender's report.
Financial Risk Tornado (in the Research module) goes a step further, perturbing technical, CAPEX, OPEX, and financing variables one at a time through the same cash-flow/tax/depreciation/debt engine as the base case, ranking each by its impact on Equity IRR — the exact metric lenders underwrite to.
The Honest Caveat Built Into the Tool
One detail worth calling out: the simulator itself is explicit that no software-generated report, however detailed, substitutes for independent third-party engineering certification. It's designed to produce a strong draft — complete with preparer credentials, an independent reviewer sign-off field, a report revision status (from "Draft for Internal Review" through "Final — Issued for Financial Close"), and a declaration confirming the report will be reviewed by a named, professionally-qualified engineer before any lender or investor relies on it.
That's a meaningful design choice. It positions the tool as a serious first draft for a bankability report — one that compresses weeks of spreadsheet work into a repeatable, standards-referenced workflow (IEC 61724-1, IEC 61724-3) — while being upfront that the final signature still belongs to a human engineer.
Why This Matters for Developers and EPCs
For a solar developer or EPC preparing a project for financial close, this two-tier financial model does three things a simple ROI calculator can't:
- Speaks the lender's language from the start — P90-based metrics, DSCR, covenant thresholds — rather than presenting optimistic P50 numbers that get rejected in diligence and have to be redone.
- Separates project and equity economics cleanly, so sponsors understand exactly what leverage is doing to their actual returns, not just the project's theoretical returns.
- Connects the financial model directly to the underlying yield simulation — CAPEX, OPEX, tariff, and covenant inputs all trace back to the same physics-based hourly energy engine, so there's no disconnect between the technical and financial halves of the report.
If you're taking a solar project from concept to financial close, running it through both the Project-Level and Equity-Level views early — before a lender's advisor does it for you — is one of the simplest ways to catch a weak DSCR or an unrealistic tariff assumption while there's still time to fix it.

Whitepaper: A white paper is a research-based document that informs readers about a complex issue, presents an organization's position on the topic, and provides a solution.