IST PVSolar Simulator Review
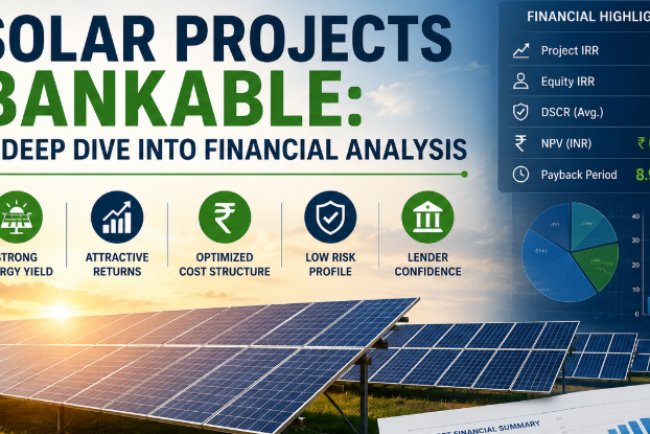
PR Newswire: IST PVSolar Simulator is a browser-based PV yield and bankability tool that takes a project from site data to a lender-style report in one workflow. It suits Indian EPCs, consultants and developers who want design, simulation, economics and EPC paperwork in one place.
IST PVSolar Simulator Review: Features, Pros vs Cons
IST PVSolar Simulator is a browser-based PV yield and bankability tool that takes a project from site data to a lender-style report in one workflow. It suits Indian EPCs, consultants and developers who want design, simulation, economics and EPC paperwork in one place. Its limits are real: the free tier is a 30-day, watermarked evaluation, and its reports do not yet carry the lender recognition of long-established desktop tools.
Pros |
Cons |
|
|
What IST PVSolar Simulator does
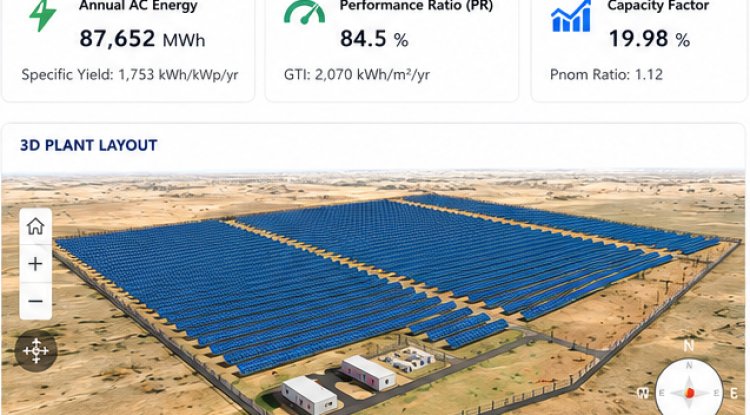
It estimates how much energy a PV plant will produce, explains where the losses go, and turns that into financial and lender-facing outputs. It covers rooftop residential and commercial, industrial, and ground-mounted utility plants, with or without battery storage. The work runs through seven steps: Project & Site, Orientation, System Parameters, Losses, Sub-array Design, Economics and Simulation.
Software capabilities
|
Area |
What it covers |
|---|---|
|
Solar resource |
Monthly table entered by hand, PVGIS TMY, NASA POWER hourly TMY, or named third-party data such as Meteonorm or SolarGIS typed in |
|
Components |
Module and inverter libraries; add new ones from .PAN or .OND files, from a datasheet PDF, or by hand |
|
Energy engine |
Monthly, hourly or 15-minute runs; Perez transposition; single- and two-diode I–V; IAM; spectral; thermal; true inverter clipping |
|
Mounting |
Fixed tilt, single-axis tracker, bifacial with view-factor rear irradiance |
|
Layout and terrain |
Trace roofs or land on a map or drone image; Auto Fit blocks, roads, inverters and substation; slopes, survey files, grading and pile heights |
|
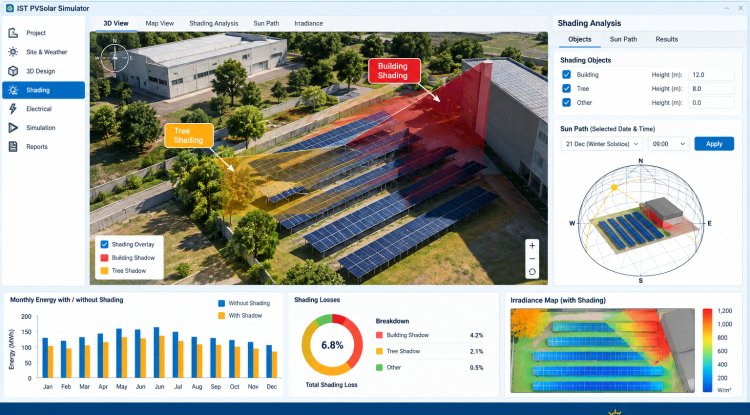
Shading |
3D object and row shading, far-horizon profile, string-level electrical loss |
|
Electrical |
String sizing checks, SLD, array table, protection and cable schedule, DC and AC cable routes with voltage drop, earthing and lightning |
|
Grid code |
LVRT/HVRT, reactive power reserve, ramp-rate limiting |
|
Storage |
Battery sizing and time-of-day tariff study |
|
Economics |
CAPEX/BOQ, OPEX, debt, tax and depreciation; LCOE, NPV, IRR, paybacks, DSCR; Monte-Carlo risk |
|
Bankability and EPC |
P50–P95 table, bankability assessment report, EPC proposal and BOQ |
|
Research tab |
Sensitivity tornado, uncertainty budget, thermal and inverter characterisation, SCADA benchmarking against measured data |
|
Batch runs |
Parametric sweeps of tilt, module, inverter or ILR, with a suggested optimum |
The standards it references include IEC 61724-1 and -3, IEC 61853, IEC 61215, IEC 62548, IS 16169, CEA rules and MNRE/ALMM. Confirm the current amendment with BIS, CEA, MNRE and your DISCOM before you finalise a design.
Can you design on your phone?
Yes for quick work, no for a full design. The app runs in any modern mobile browser, the layout adapts to small screens, and the map and site tool supports drag to pan and pinch to zoom. That is enough to open a project, check results, trace a simple roof or show a client a layout on site.
A full design is a laptop or desktop job. The workflow has seven steps, wide loss and cash-flow tables, a 3D view and multi-page print reports. Large layouts take 10–20 seconds to build shading tables, and PDF export goes through the browser print dialog, which is clumsy on a phone. Projects also save as .pro files on the device, so move the file to your computer when you switch.
The 30-day evaluation is restricted
The Free plan lasts 30 days and is built to show the engine, not the business case. You can design, simulate and see energy yield, losses and the electrical drawings. You cannot test the outputs that usually decide a purchase.
|
Feature |
Free (30 days) |
Starter |
|---|---|---|
|
Energy simulation, bifacial, tracker, BESS |
Yes |
Yes |
|
3D site and shadow analysis |
Yes |
Yes |
|
SLD, array table, cable schedule |
Yes |
Yes |
|
Financial and economic analysis |
No |
Yes |
|
Bankability analysis and report |
No |
Yes |
|
EPC documentation |
No |
Yes |
|
Research and advanced analysis |
No |
Yes |
|
Unlimited projects |
No |
Yes |
|
PDF watermark |
"DEMO Version" |
None |
|
Success manager and support |
No |
Yes |
Plan the trial around one real project. Run it hourly with a measured TMY, compare the yield with a tool you already trust, and ask sales for a short unlock if you need to see the economics before you pay. The homepage invites exactly that request for the first month.
Shading analysis: choose the model deliberately
The shading result depends on which path you take, so pick it on purpose and state it in the report. Only the traced 3D layout, applied and run hourly, gives a true time-series shading loss.
|
Path |
How it works |
Use it for |
|---|---|---|
|
Typed percentage |
A flat Shading Loss % in Step 4; applied only in Monthly runs |
Early what-if work only |
|
Generic row formula |
Geometric row-to-row factor from GCR, tilt and sun angle |
Quick sizing with no layout |
|
3D layout, Monthly run |
Apply builds a 12×24 month-by-hour table; Monthly runs use its yearly estimate |
Fast comparisons of layouts |
|
3D layout, Hourly/15-min run |
Direct light cut at each sun position; diffuse cut by blocked sky; string loss counted with a 15% bypass limit |
Final and bankable numbers |
|
Far-horizon profile |
Terrain or skyline horizon applied hour by hour |
Hilly sites and dense surroundings |
Three points trip users up. First, the Loss % (shading) figure in the 3D tool is a design check: the share of modules shaded at the worst moment on 21 December between 09:00 and 15:00. It is not the annual loss. Second, a module is judged at its centre, so it counts as fully lit or fully shaded; finely shaded rooftops will be approximated. Third, after editing objects, heights or the latitude, click Apply Shading Loss to Simulation again and re-run, or the old table stays in use.
The Research tab can compare five row-shading models (raycast, sky-view, isotropic, Perez and near-shading) on the same design. Use it to see how sensitive your result is to the diffuse treatment.
P50/P90: probabilistic output with defined limits
P90 is the yield the plant should beat in 9 years out of 10, and the tool derives it from an uncertainty budget you control. The default budget gives a combined spread of 7.62%, so P90 lands about 9.8% below P50.
\sigma_{total} = \sqrt{IAV^2 + Data^2 + Model^2 + Component^2} = \sqrt{5^2 + 5^2 + 2^2 + 2^2} = 7.62\%|
Source (1σ) |
Default |
What it represents |
|---|---|---|
|
Inter-annual variability (IAV) |
5% |
Year-to-year weather spread |
|
Resource data |
5% |
Error in the long-term irradiance estimate |
|
Model |
2% |
Transposition and conversion physics |
|
Component |
2% |
Module and inverter tolerance |
Know the limits before you quote a P90:
- It assumes a normal distribution. Real resource data can be skewed, especially in monsoon climates.
- Defaults are generic. Replace the data term with your source's stated uncertainty and the IAV with its year-to-year GHI variability.
- Synthetic weather is not bankable. Without a TMY, hourly weather is built from the monthly table. It is repeatable but not measured.
- Single-year vs multi-year. The static table treats IAV as one-year spread. The Monte-Carlo draws IAV separately each year, so its year-1 spread will not match the table exactly. This is intended.
- Excluded risks. Curtailment, grid outages, long-term soiling trends and construction defects sit outside the budget unless you add them as losses.
Economic outputs need their own assumptions
The financial model is only as good as the inputs you replace, and its defaults are Indian placeholders, not your project. A good yield with a default tariff gives a precise-looking IRR that means little.
A few behaviours are worth knowing. Financial KPIs are calculated on P90 energy, which is conservative by design. The bankability check compares your CAPEX per Wp with country bands, which catches an unrealistic number early. The Monte-Carlo samples energy, degradation, tariff and OPEX escalation over 5,000 trials by default. The vendor states that these outputs are decision support, not investment advice; confirm tariffs, subsidies and tax with current DISCOM, CERC and CBDT rules.
Report acceptance and software comparisons
No simulation report is automatically accepted; lenders accept the reviewer and the inputs, then the tool. Independent engineers judge the resource data, loss assumptions, uncertainty budget and who signed the report. The bankability report helps here: it records the preparer, reviewer and data provenance, takes lender-specific covenant thresholds, and scores Technology, Developer and Project bankability.
The honest gap is familiarity. Many lenders and IEs still ask for a PVsyst run for MW-scale projects. Ask your lender early whether they accept this tool's report, or whether they want a parallel PVsyst run for financial close. The .PAN and .OND import makes that cross-check easier.
|
Tool |
Platform |
Strength |
Weak spot vs IST |
|---|---|---|---|
|
IST PVSolar Simulator |
Browser |
Design, yield, finance, bankability and EPC documents in one place; India-ready |
Newer; lender recognition still growing |
|
PVsyst |
Windows desktop |
The long-standing lender reference for yield studies |
Little finance or EPC output; desktop licence |
|
HelioScope |
Browser |
Fast commercial layout and design |
Lighter on financial and bankability outputs |
|
SAM (NREL) |
Desktop, free |
Deep financial models, open methods |
Steeper set-up; no layout or EPC drawings |
|
PVGIS (EU JRC) |
Browser, free |
Quick yield estimates and TMY data |
Estimate only; no detailed design |
Use IST PVSolar Simulator where speed from site to proposal matters, such as rooftop, C&I and early utility work. For financial close on large projects, check what the lender expects first.
Frequently asked questions
Does IST PVSolar Simulator include design and panel layout functions?
Yes. You trace roofs or land on a map or drone image, place modules, and Auto Fit lays out ground-mounted plants into blocks with rows, roads, inverters and a substation. Layout also handles sloped terrain, grading and pile heights, and produces the SLD, array table and cable routes from the same design.
Does an IST PVSolar Simulator report guarantee lender acceptance?
No. The vendor's own terms say outputs are estimates and not a guarantee of performance or return. Acceptance depends on the lender, its independent engineer, your resource data and assumptions. Confirm early whether they will accept this report alone or want a PVsyst cross-check.
How long does it take to learn IST PVSolar Simulator?
The vendor does not publish a figure. A PV engineer can usually run a first simulation in a day, because the steps follow the familiar site, orientation, components, losses, layout, economics order. Reaching reliable bankable work, with 3D shading, uncertainty budgets and the finance model, typically takes a few weeks of real projects. The built-in help and video tutorials shorten this.
What are the hardware requirements to run IST PVSolar Simulator?
There is nothing to install, and the vendor does not publish minimum specifications. You need a current Chrome, Edge, Firefox or Safari browser with WebGL for the 3D view and a stable internet connection. For large layouts and hourly runs, a laptop or desktop with 8 GB of RAM or more and a full-size screen is a sensible baseline. Online elevation needs access to api.open-meteo.com.
How much support is included with the IST PVSolar Simulator licence?
Paid plans (Starter and IST Alumni Gold) include a dedicated success manager and what the vendor calls "99.9% support". The Free plan includes neither. Response times and channels are not published, so ask sales to confirm them in writing before you buy.
Are the licences transferable between team members?
Every plan is for a single user, and the terms ask you to keep your account credentials secure, so sharing one login is not intended. The published terms do not cover moving a licence to a colleague. If staff change, contact IST to reassign the seat; for several engineers, ask for team pricing.
Sources
- IST PVSolar Simulator — Plans and pricing
- IST PVSolar Simulator — Terms & Conditions
- IST PVSolar Simulator — Home
- IST PVSolar Simulator in-app Help & User Guide, August 2026 build

Whitepaper: A white paper is a research-based document that informs readers about a complex issue, presents an organization's position on the topic, and provides a solution.