Shading in IST PVSolar Simulator
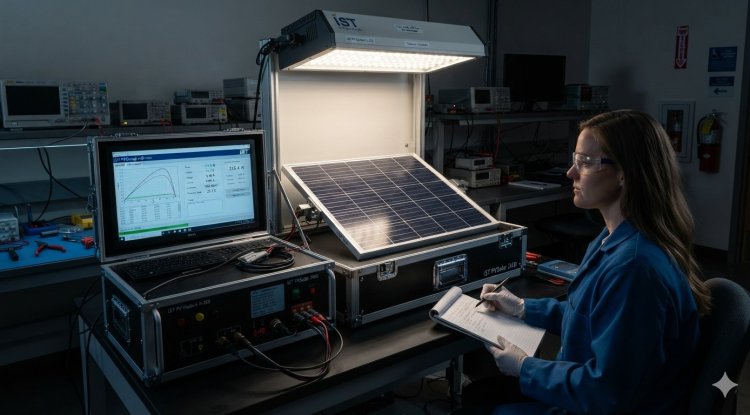
PR Newswire: IST PV Simulator runs an hourly simulation of 8,760 steps a year. It models near shading in two ways: a 2D row-to-row calculation for regular rows, and a 12×24 shading table produced by its 3D roof tool for rooftops with obstacles.
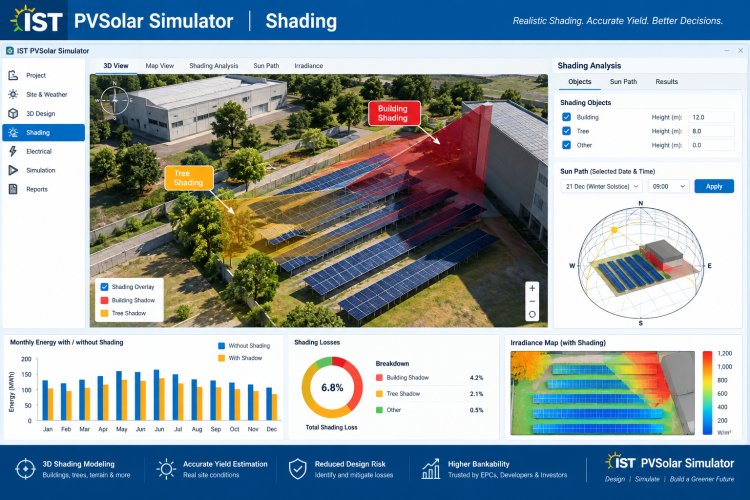
IST PVSolar Simulator runs an hourly simulation of 8,760 steps a year. It models near shading in two ways: a 2D row-to-row calculation for regular rows, and a 12×24 shading table produced by its 3D roof tool for rooftops with obstacles.
Its 15-minute mode divides each hour into four steps by interpolating the hourly weather. That is not the same as a true sub-hourly simulation, which needs weather measured or generated at 5 or 15 minutes.
Other tools go further on two points. PVsyst 8.1 runs a true sub-hourly simulation and computes electrical mismatch from the position of every module in a 3D scene. HelioScope simulates at module level and can build the scene from LIDAR data.
Two settings decide how far any yield number can be trusted: the time step and the shading model. This article explains what IST PVSolar Simulator does at each one, in plain terms, and when the simpler method is enough.
The hourly run: 8,760 steps
The standard simulation takes one typical year of hourly weather and works through it hour by hour. The weather comes from a PVGIS, NASA POWER or imported from other data scouces typical meteorological year.
In each daylight hour the engine follows the same chain.
- It finds the sun's position in true solar time, at the middle of the sunlit part of the hour.
- It converts horizontal irradiance to the module plane with the Perez model and applies the far horizon.
- It applies near shading, the incidence-angle loss and a spectral correction.
- It calculates cell temperature from irradiance, ambient temperature and wind.
- It finds module power from a one-diode model, using the .PAN file when one is loaded.
- It applies DC wiring loss, the inverter's voltage window, its efficiency curve and its power limit.
- It applies AC wiring, transformer losses and any grid export limit.
Night hours are kept so that inverter and site consumption are counted. The result can be exported as an 8,760-row file with about 50 variables per hour, so every step can be checked.
15-minute mode is not true sub-hourly simulation
The 15-minute mode runs four steps per hour, but the weather inside each hour is a straight line drawn between two hourly values. It sharpens the geometry and leaves the clouds out.
|
|
IST PVSolar Simulator 15-minute mode |
True sub-hourly simulation |
|---|---|---|
|
Weather input |
Hourly irradiance, temperature and wind, interpolated to 15 minutes |
Irradiance measured or generated at 5 or 15 minutes |
|
Sun position |
Recalculated every 15 minutes |
Recalculated every step |
|
Passing clouds within the hour |
Not represented |
Represented |
|
Short power peaks above the inverter limit |
Smoothed out |
Captured |
|
What improves over hourly |
Sun angle, the moment shading starts, tracker angle |
The same, plus clipping, export-limit and battery behaviour |
The difference shows up in clipping. On a bright, broken-cloud day, irradiance jumps above the hourly average for a few minutes at a time. If the DC array is much larger than the inverter, those peaks are clipped. An hourly average hides them, and so does a straight line between two hourly averages.
Near shading between rows: the 2D model
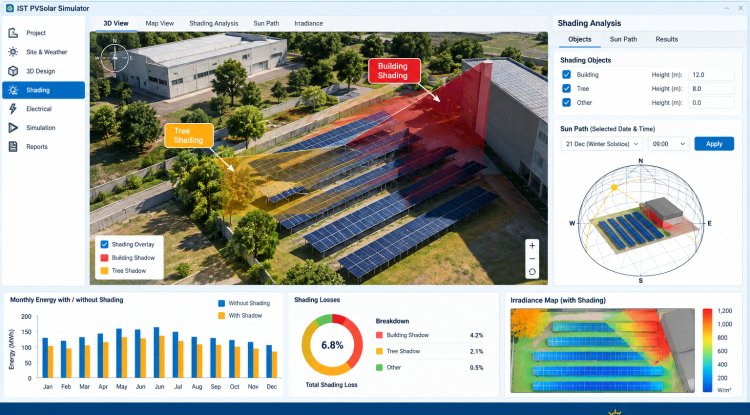
For regular rows, the engine treats the array as a cross-section: one row, the row in front of it, and the gap between them. From the sun's height and direction it finds how far up the rear row the shadow climbs in each step.
That shaded height is used in three ways.
- Direct light. The beam component is reduced in proportion to the shaded height.
- Diffuse light. A sky-view factor, set by tilt and ground cover ratio, accounts for the sky hidden by the row in front. Ground-reflected light is masked in the same way.
- Electrical effect. The loss is larger than the shaded area suggests, because a shaded cell limits its whole bypass section. The engine solves each module with a diode model, section by section.
Module orientation changes the result. In portrait, a low shadow crosses every bypass section at once, so a thin strip of shade can cut most of the module's output. In landscape, the sections are stacked, and the shadow takes them out one at a time. Half-cut modules are handled as two parallel halves.
For single-axis trackers the same geometry drives backtracking, using the ground cover ratio.
The model assumes long, evenly spaced rows on flat ground. It does not see row ends, uneven terrain or objects between the rows.
Roof shading: from a drone image to a 12×24 table
On a rooftop, shade comes from parapets, tanks, stair blocks and neighbouring buildings, not from tidy rows. The 3D roof tool turns a drone image of the site into a shading table the hourly engine can use.
- Upload the image. A drone orthomosaic in JPG, PNG or GeoTIFF. If it is geo-referenced the scale is set automatically, and the tool checks it against the recommended 2 to 5 cm per pixel.
- Outline the roof. Trace it on the image, or load the boundary from a GeoJSON or KML file.
- Mark the obstacles and give each a height. Parapets, chimneys, ventilators, trees, antennas and nearby buildings. A shadow scan can flag dark areas in the image as a starting point.
- Lay out the panels. Auto-fit fills each roof area at its own tilt and azimuth, and a worst-hour check sets the row spacing.
- Build the table. For the 15th day of each month and each hour of the day, the tool casts the shadow of every obstacle and every row. It then counts the panels whose centre lies in shade.
- Run the simulation. The result is 288 values, 12 months by 24 hours, each the unshaded share of the array. The hourly engine multiplies direct light by the matching value.
A 3D preview shows the scene and a ray-cast heat map of where the shade falls through the year. That map is for inspection. The energy calculation uses the 12×24 table.
The table has four limits. It samples one day per month. Each panel counts as fully lit or fully shaded. Diffuse light is not reduced by the obstacles. One value describes the whole array, not each string.
A LAS or LAZ point-cloud file can be loaded alongside the image, but only its elevation range is read, to pre-fill the building height. The 3D scene is not built from LIDAR.
How other tools handle the same two questions
PVsyst and HelioScope resolve shade at the level of the module or the string. IST PV Simulator resolves it at the level of the array.
|
|
PVsyst 8.1 |
HelioScope |
|
|---|---|---|---|
|
Time step |
Hourly; 15-minute mode on interpolated data |
Hourly and true sub-hourly |
Hourly, 8,760 steps |
|
How the scene is built |
Traced on a drone image, obstacles given heights |
3D scene built from shapes or imported from CAD files and terrain data |
Layout drawn in the browser; LIDAR data on the Pro plan |
|
Shading resolution |
One value per month and hour for the whole array |
Shading factors by sun position, then by string in the module layout |
Each module, each hour |
|
Electrical mismatch |
Bypass-section model for shadows between rows |
Calculated from the actual position of every module |
Simulated at module level |
The practical difference is in what each tool can tell you. A module-level result shows which string loses energy to a water tank and whether moving four panels fixes it. An array-level table gives the total loss, not its location.
The takeaway
IST PV Simulator gives an hourly, 8,760-step energy model with a clear loss chain, a physical row-shading model and a quick route from a drone image to a roof shading table. That covers most commercial rooftop and regular ground-mount work.
It does not yet offer true sub-hourly simulation, module-level shading or a LIDAR-built scene. Where a project depends on those, say so in the report and back the number with a tool that has them.
Knowing which method produced a yield figure is part of trusting it. A simulator that states its method plainly gives the engineer, the client and the bank a number they can question and defend.
Sources: PVsyst release notes, Heaven Green Energy PVsyst review (its publisher sells a competing product), HelioScope product page, Heaven Green Energy HelioScope review.

RE News: Renewable energy Latest News & Resources - including solar, wind, hydropower, biofuels and others new and appropriate energy generation technology.